
STRAVA GRAPHS - CONSISTENT TRAINING FOR 3 MONTHS NOT 3 JUST WEEKS
If you’re on Strava, have you ever looked at your ‘last 12 weeks’ graph?
I think it’s one of the more important stats we get from Strava.
It tell us how consistent we have been over the previous 12 weeks - giving us a longer term view of our training.
Forget about those key sessions where we can get plenty of ‘kudos’ from running mates, forget about cadence, calories burned and even heart rate data for a second.
Training like an animal for a week isn’t going to make you the fittest you’ve ever been… but 12 weeks of consistency just may.
*even better is months & years of consistency, but let’s focus on the 12 weeks for now.
Before we get stuck into analysing the ideal training block I will say that the number of kilometres you clock up each week isn’t the single factor to judge training consistency and progression but it’s one of the best guides we have.
Training intensity may also be something to consider in your overall training load, but that’s for another blog.
If you haven’t already jumped back to your Strava account to check your 12 week graph, I bet it will be the first app you open up after reading this.
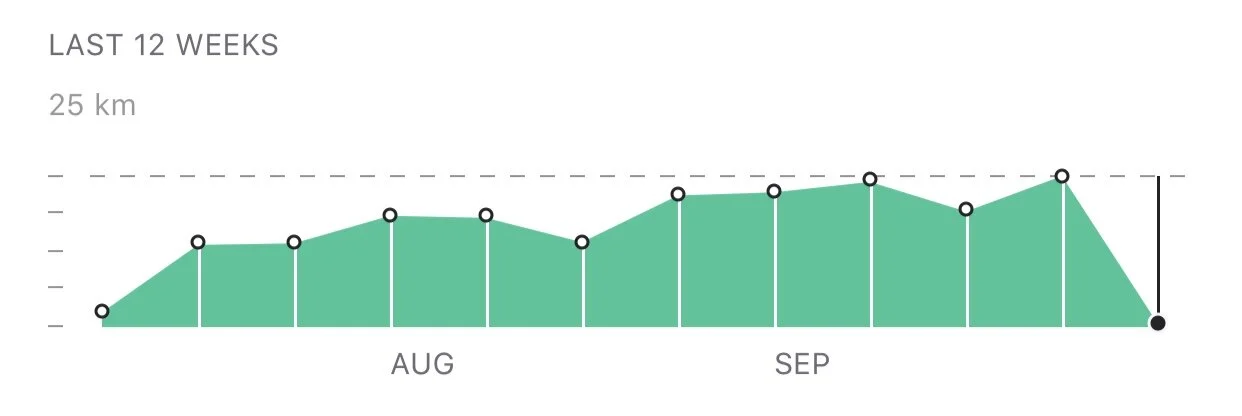
Check out a few versions of a 12 week running routine I’ve come across;
Big rise, big fall
This graph isn’t a great representation of consistent training with a big fall, to almost no running closely followed by the biggest training week of the period. Try to avoid a big rise and fall in total kms week to week.
This is a risky progression.

Consistent build
This graph looks like it follows the 10% rule we’ve mentioned in previous blogs. Training is increasing week by week but only very gradually. This person may be building up for an event or returning from injury - would look for a plateau in kms soon.
This is a good progression.

Consistent base training
This graph is very consistent. Someone who has found their groove and laying an awesome base of training. Rather than building up total distance each week they may be finding variety in the training sessions they’re doing week to week.
This is a very good progression.

Consistent build with recovery weeks
This graph shows a slow build in kms week to week but also has 2 drops in the graph as it trends upwards. These illustrate recovery weeks to absorb training as the overall load progresses. This is actually one of our Run Rabbit runners who’s building for their first half marathon. If they do another training program after this one it would look more like the ‘consistent base training’ graph above with recovery week incorporated.
The is a great, low risk progression.
Keep in mind, when aiming for consistent training, the idea is that it is sustainable. There’s no way your training can be consistent if you’re finishing each week forcing yourself to back up for the next one. That’s why recovery weeks every month are awesome.
Listening to your body will always take priority over any numbers you’re chasing in training. If you’ve got a niggle coming on, don’t delay a few of easy days or reducing your overall load in the pursuit of an impressive 12 week graph.
The main thing to remember is to avoid big unnecessary rises and falls in your training load.
And if you’re after some help, we’re always happy to chat - contact us.